Rethinking Digital First
Reducing costs without reducing delight: What started as a benchmarking task became a deeper investigation — revealing that forcing physical cards was driving waste, support calls, and delayed product use.

Overview
Physical cards incur significant costs in printing and delivery, yet we knew asking users to pay upfront would lead to a frustrating experience.
With Nomo being an international bank, it’s normal for the leadership to feel a level of uncertainty about market norms and user expectations.
Selective benchmarking can be a great starting point to align everyone on the team, but that does not mean exploring other options - now is not the right time for solutionizing 💡
Research Questions
How do competitors price and position physical cards?
When do customers perceive physical cards as valuable?
Would introducing friction encourage digital adoption?
Can we reduce printing and delivery waste if demand is lower?
Research Strategy
-
Understand market norms to assess fee viability

-
Determine actual reliance on physical cards
-
Quantify costs, friction & failure points
-
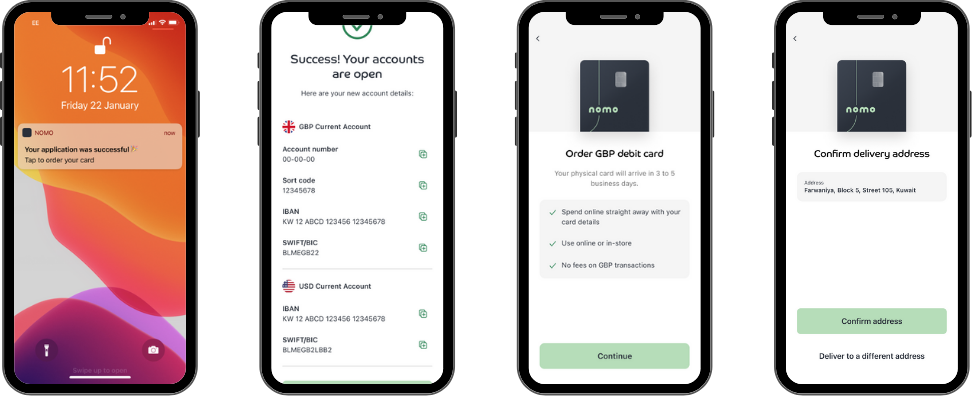
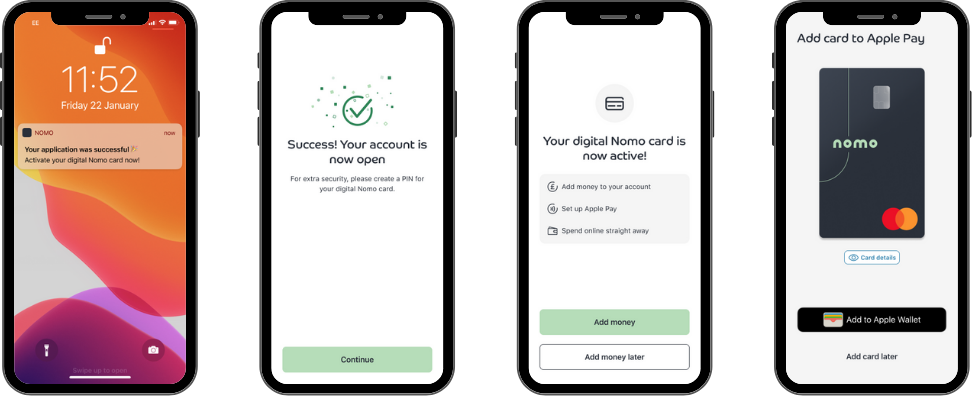
Simplify card activation & enable faster use
Service Blueprint
This is a very abstract top-level view of this activity
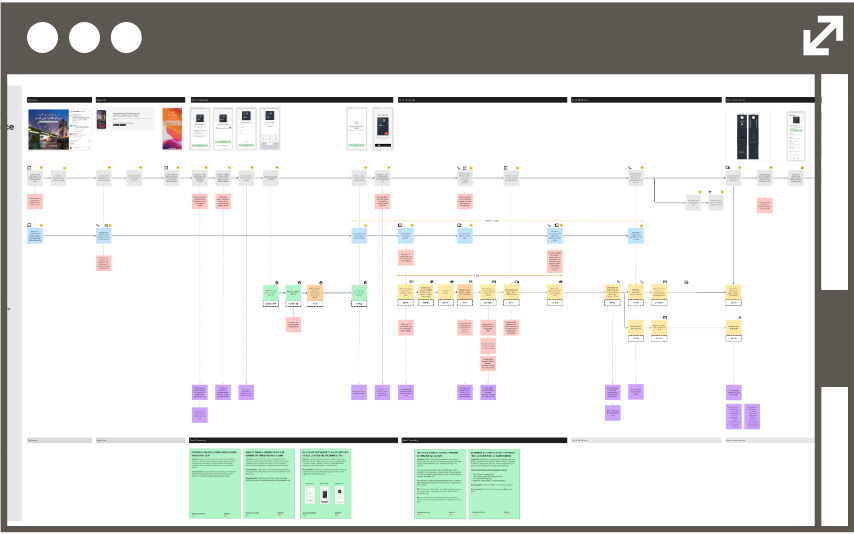
Example
Operational inefficiencies and user friction in card issuance
Hundreds of cards are destroyed every quarter due to failed delivery
500+ delivery-related support cases per month
No delivery tracking, high CS dependency
A Large gap between the number of Cards ordered → Card activated
Benchmarking Findings
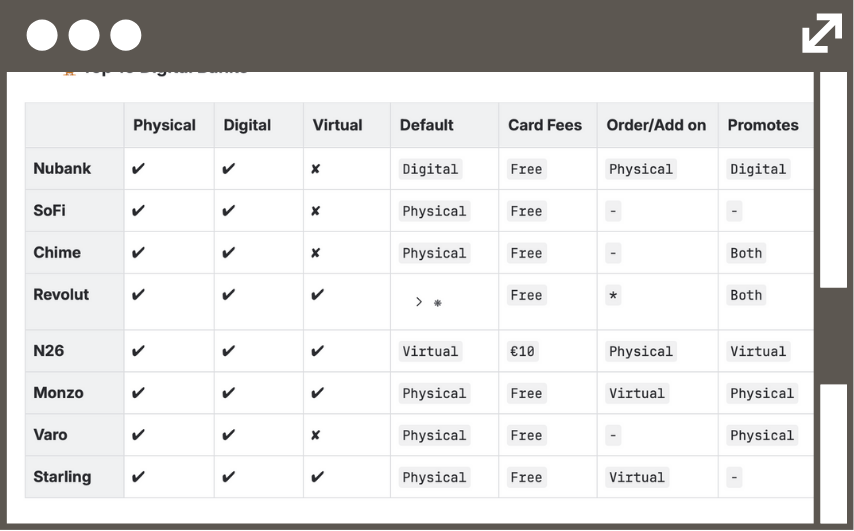
Physical cards are free in 21/22 cases
Charging for cards is:
Out of market norms
A competitive disadvantage
Friction to funding
Digital-first messaging is standard
Example
Where fees exist
Upgraded cards (e.g., metal or personalized)
Replacement and supplementary cards
In banks offering multiple virtual cards.
Behavioural Data Findings
We found the mismatch
Originally, this is what the data looked like:
61% total spend is point-of-sale
Physical card POS usage ~ 30%
After a data request to get the Apple Pay APIs:
74% of POS spend on Apple Pay
Physical card POS usage ~ 12%
With the new data:
Digital wallet adoption is increasing month-over-month
Customers already transact digitally
🤔 Something in our journey was discouraging the user’s preferred behaviour
For the nerds: Layering transactional data on top of what was originally a card delivery issue revealed a behavioral layer we weren't aware of, and it required asking more questions, like, who are these 10%?
Design Review + Changes
12-Month Impact
76% ↓
Cards ordered per month
89% ↓
Time to first time transfer